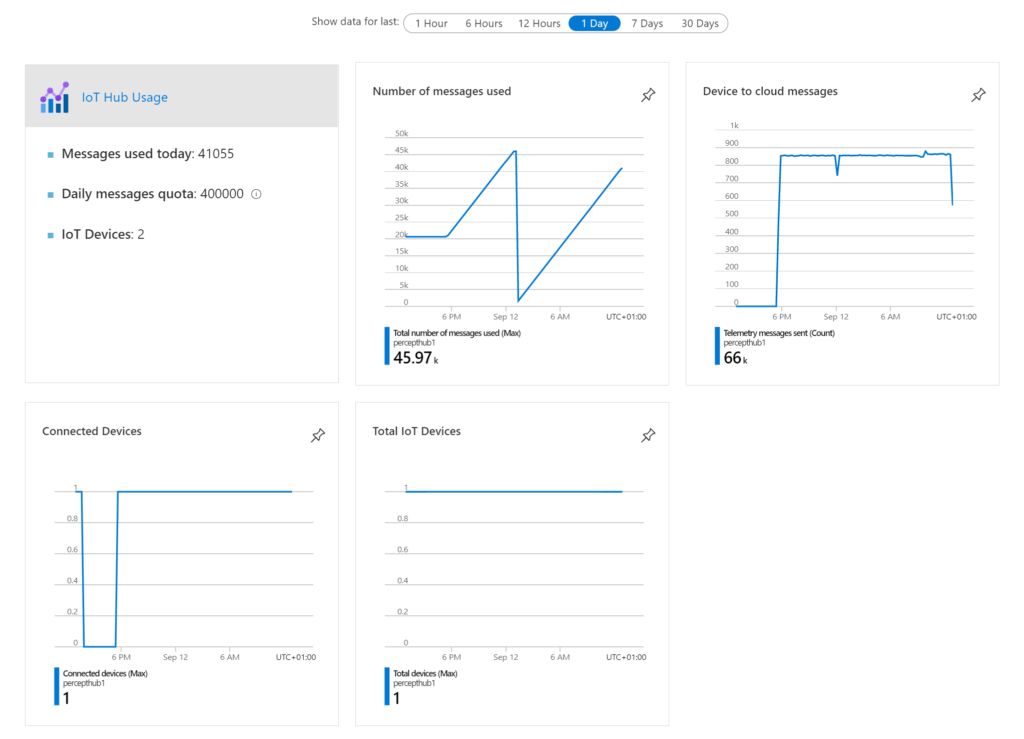
When implementing Azure IoT solutions, we’re used to using the excellent Azure Monitor service to surface metrics around our IoT Devices and Services.
For IoT Edge devices however, we need to perform a few configuration steps to enable us to Gather metrics.
For my particular solution, I’ll be using a Raspberry Pi as my IoT Edge device, however these instructions will work for most Linux implementations that support Prometheus and Grafana.
Configure IoT Edge Metrics
The IoT Edge runtime modules automatically collect and surface metrics using the Prometheus Exposition Format.
The EdgeAgent and EdgeHub modules both expose these metrics, accessible using a web browser. on port 9600 within the Edge Runtime.
However, In order to have access to these two sets of Metrics, we need to map the individual port 9600 from each Module to an external port.
In order to map the metrics ports, we modify the IoT Edge Deployment Manifest file, adding the relevant exposed ports and Mapping port 9600 on each module to a free public facing port.
As a note, I’ll be using VS Code and the IoT Tools extension to manage the editing and deployment of the changes we’re going to make, but it’s also possible to carry out some of these steps directly in the portal if you so wish.
Here’s an example IoT Edge Deployment Template;
{
  "$schema-template": "2.0.0",
  "modulesContent": {
    "$edgeAgent": {
      "properties.desired": {
        "schemaVersion": "1.0",
        "runtime": {
          "type": "docker",
          "settings": {
            "minDockerVersion": "v1.25",
            "loggingOptions": "",
            "registryCredentials": {
              "pjgiotedgedevops": {
                "username": "$CONTAINER_REGISTRY_USERNAME_pjgiotedgedevops",
                "password": "$CONTAINER_REGISTRY_PASSWORD_pjgiotedgedevops",
                "address": "pjgiotedgedevops.azurecr.io"
              }
            }
          }
        },
        "systemModules": {
          "edgeAgent": {
            "type": "docker",
            "settings": {
              "image": "mcr.microsoft.com/azureiotedge-agent:1.0",
              "createOptions": {

              }
            }
          },
          "edgeHub": {
            "type": "docker",
            "status": "running",
            "restartPolicy": "always",
            "settings": {
              "image": "mcr.microsoft.com/azureiotedge-hub:1.0",
              "createOptions": {
                "HostConfig": {
                  "PortBindings": {
                    "5671/tcp": [
                      {
                        "HostPort": "5671"
                      }
                    ],
                    "8883/tcp": [
                      {
                        "HostPort": "8883"
                      }
                    ],
                    "443/tcp": [
                      {
                        "HostPort": "443"
                      }
                    ]
                  }
                }
              }
            }
          }
        },
        "modules": {
          "NodeModule": {
            "version": "66.0",
            "type": "docker",
            "status": "running",
            "restartPolicy": "always",
            "settings": {
              "image": "${MODULES.NodeModule.debug}",
              "createOptions": {

              }
            }
          },
          "SimulatedTemperatureSensor": {
            "version": "1.0",
            "type": "docker",
            "status": "running",
            "restartPolicy": "always",
            "settings": {
              "image": "mcr.microsoft.com/azureiotedge-simulated-temperature-sensor:1.0",
              "createOptions": {}
            }
          }
        }
      }
    },
    "$edgeHub": {
      "properties.desired": {
        "schemaVersion": "1.0",
        "routes": {
          "NodeModuleToIoTHub": "FROM /messages/modules/NodeModule/outputs/* INTO $upstream",
          "sensorToNodeModule": "FROM /messages/modules/SimulatedTemperatureSensor/outputs/temperatureOutput INTO BrokeredEndpoint(\"/modules/NodeModule/inputs/input1\")"
        },
        "storeAndForwardConfiguration": {
          "timeToLiveSecs": 7200
        }
      }
    }
  }
}
On lines 26 and 37, we can see the “createOptions” sections. These are the sections we need to modify in order to map the required ports for our Metrics.
We can see part of the section already exists for the edgeHub module beginning on line 37, where the ports for SSL (443), AMQP (5671) and MQTT (8883) are all mapped for us.
We need to map port 9600 to a port for each of the edgeAgent and edgeHub and expose these ports out from IoT Edge so we can access them.
We can achieve that for the edgeAgent by adding the following code snippet to the createOptions for this module on line 27;
"ExposedPorts": {
    "9600/tcp": {}
},
"HostConfig": {
    "PortBindings": {
        "9600/tcp": [
            {
                "HostPort": "9601"
            }
        ]
    }
}
We now need to repeat this for the edgeHub Module. However, as we can see, there are already some port mappings defined here.
You can either add the required port mapping in to what you already have, or, assuming you’ve not made any modifications yourself, replace the createOptions section for the edgeHub with the following, where we’ve added the Exposed Ports and the binding for port 9600 mapping it to port 9602;
"ExposedPorts": {
    "9600/tcp": {}
},
"HostConfig": {
    "PortBindings": {
        "5671/tcp": [
            {
                "HostPort": "5671"
            }
        ],
        "8883/tcp": [
            {
                "HostPort": "8883"
            }
        ],
        "443/tcp": [
            {
                "HostPort": "443"
            }
        ],
        "9600/tcp": [
            {
                "HostPort": "9602"
            }
        ]
    }
}
We’ve now mapped port 9600 on both the edgeAgent and edgeHub modules to 9601 and 9602 respectively, allowing us to access them from a browser.
Create an IoT Edge Deployment
We now need to update our IoT Edge device based on our new Deployment Manifest
Once again, I’ll be using VS Code and the IoT Tools Extension here, but you can also paste the create options settings into the “Container Create Options” for the Runtime Settings of your IoT Edge Device. These can be access by navigating to your IoT Edge Device in IoT Hub, then to the “Set Modules” blade, and clicking on the “Runtime Settings” button under “IoT Edge Modules”;
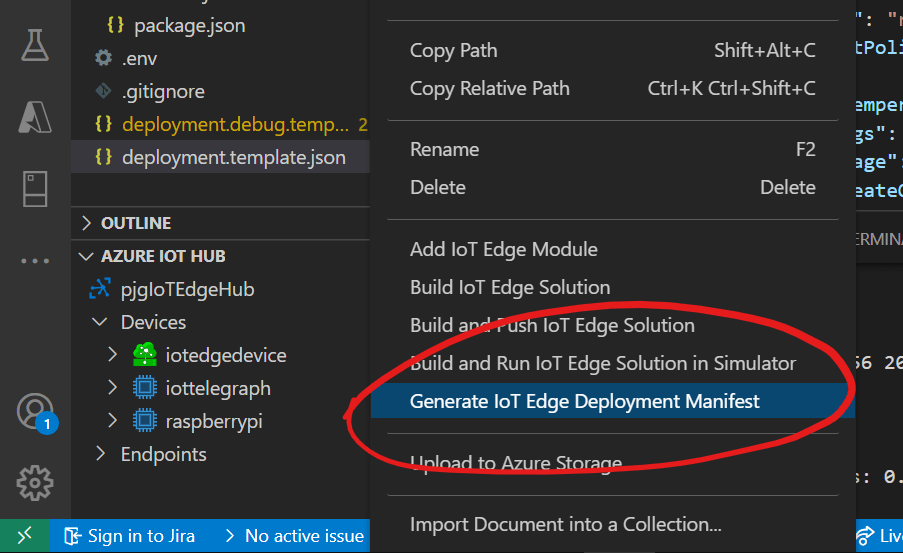
From VS Code, assuming that you’ve completed the setup of the IoT Tools Extension, selected the correct Azure Subscription, IoT Hub for your IoT Device and configured the default deployment platform, we can right click on our Deployment Template and create a Deployment Manifest;
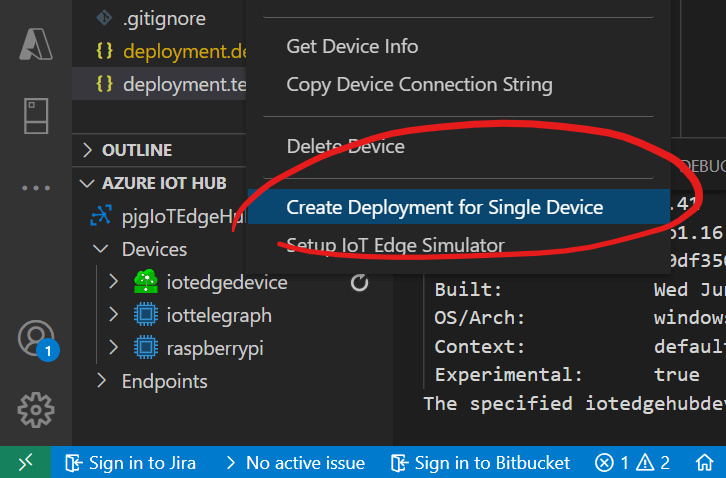
Once the Deployment Manifest is generated, we can then deploy the changes to our IoT Device.
Right click on your IoT Edge Device and select “Create Deployment for Single Device”;
In the File Picker, navigate to your config directory, and select the deployment.json file (or the name of your deployment json file, which may be named platform specifically, such as deployment.arm23v7.json for instance).
View the Raw Metrics
After a small wait for the IoT Edge device to update the Modules on the device, (you can check the progress by issuing the docker ps -a command, or by using the portal to check the status of the modules), we can then open a browser and navigate to the pages for the raw metrics.
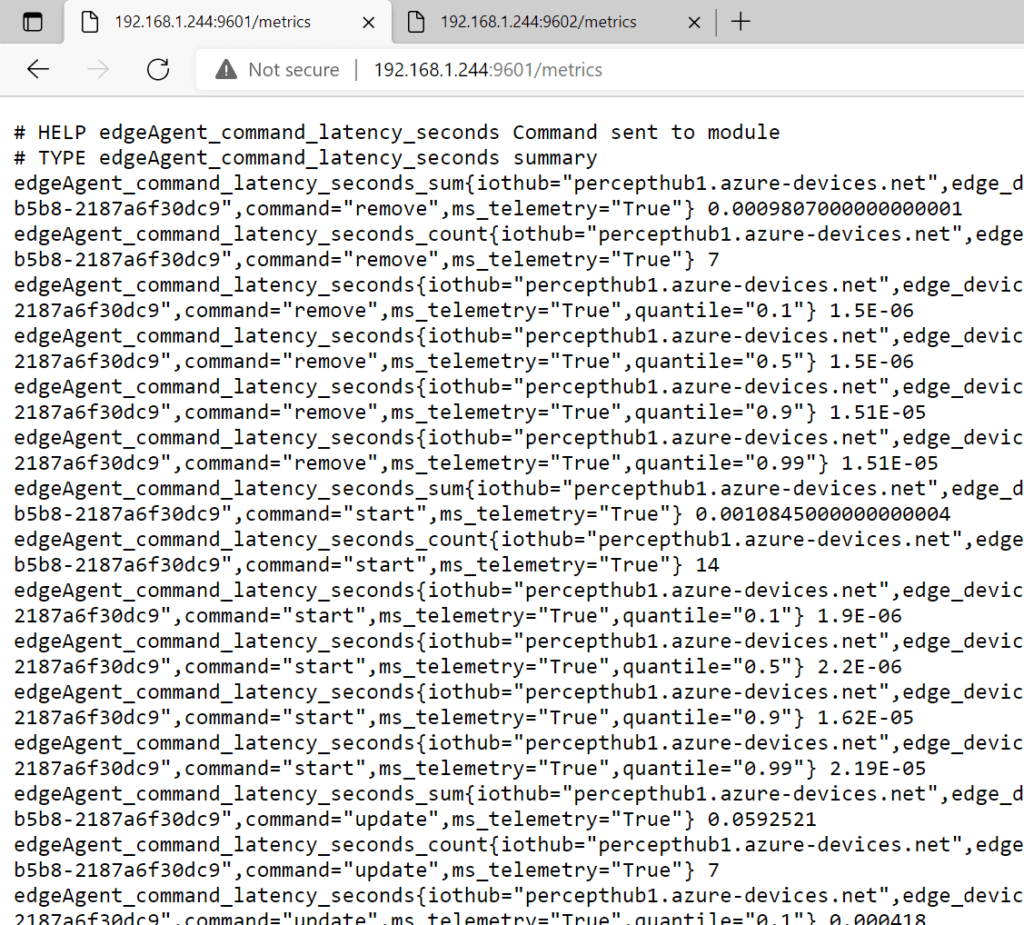
If we navigate to the IP address of our IoT Edge Device and add :9601, then we’ll see the raw metrics for the edgeAgent Module;
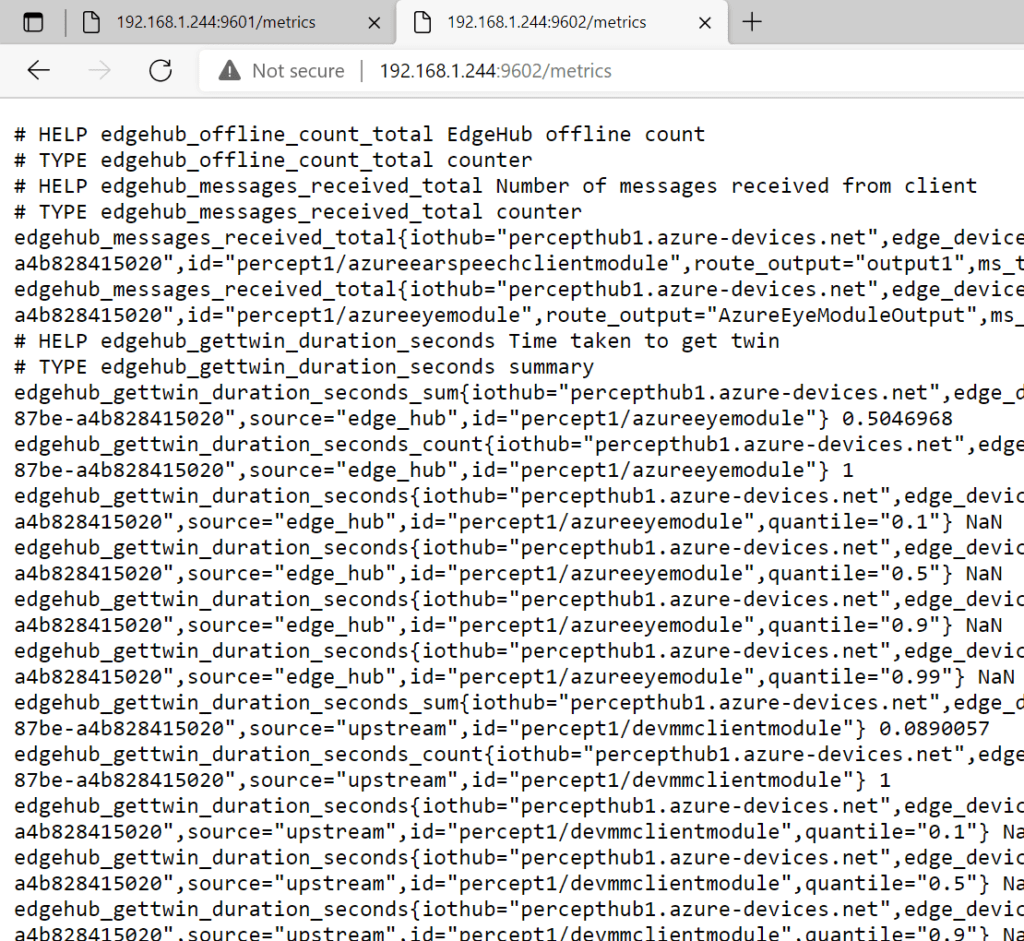
Likewise, if we navigate to our IoT Edge Device IP address and add :9602, then we’ll see the raw metrics for the edgeHub Module;
Add the Metrics Feeds to Prometheus
My particular IoT Edge solution uses a Raspberry Pi
If you haven’t already installed Prometheus, then there’s an excellent tutorial here on the PiMyLifeUp site;
https://pimylifeup.com/raspberry-pi-prometheus/
Once you have Prometheus installed and configured, we need to add the two Metrics Feeds as new Nodes in our Prometheus installation.
Using the following command, open the Prometheus configuration file;
nano /home/pi/prometheus/prometheus.ymlScroll down and find the “scrape_configs” section;
# A scrape configuration containing exactly one endpoint to scrape:
# Here it's Prometheus itself.
scrape_configs:
  # The job name is added as a label `job=<job_name>` to any timeseries scraped$
  - job_name: 'prometheus'

    # metrics_path defaults to '/metrics'
    # scheme defaults to 'http'.

    static_configs:
    - targets: ['localhost:9090']
Beneath the last “static_configs” item, add the following lines to include our Metrics feeds;
  - job_name: 'iotedge_agent'

    static_configs:
    - targets: ['localhost:9601']

  - job_name: 'iotedge_hub'

    static_configs:
    - targets: ['localhost:9602']
Save and Exit using “ctrl+x” and then “y” followed by hitting enter.
Restart to the Prometheus service using;
sudo systemctl restart prometheusWe can now check if Prometheus is picking up our feeds correctly.
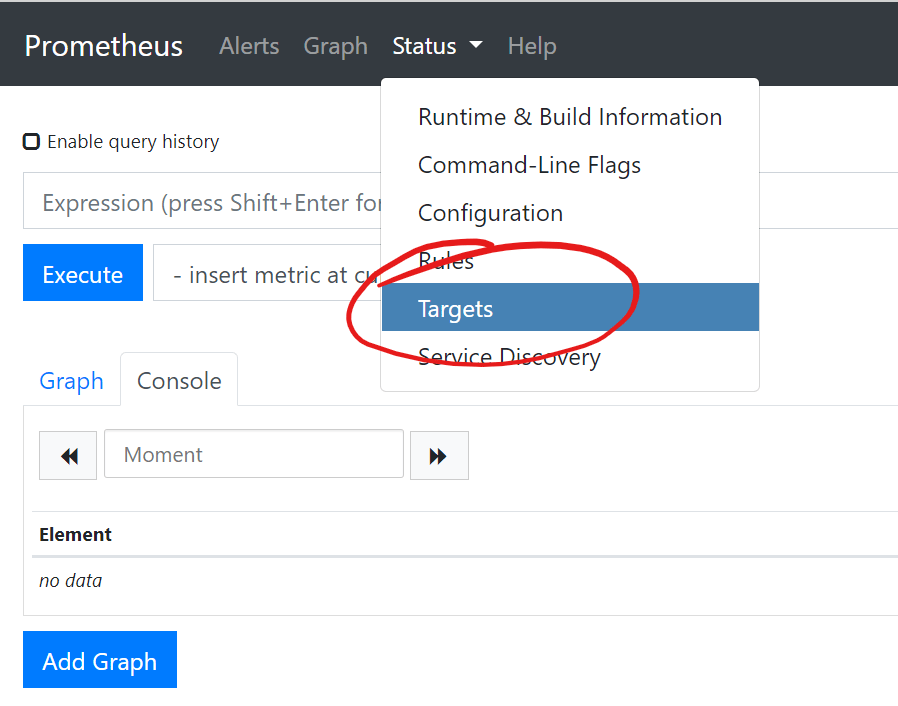
Navigate to your Prometheus Instance, and under the Status” menu Item, select “Targets”;
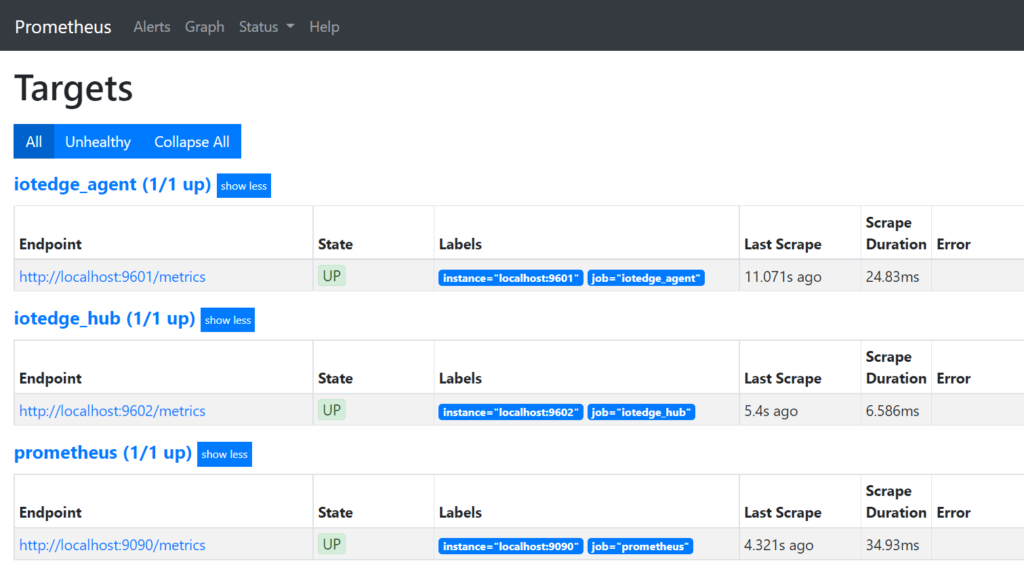
You should then see all the configured targets, and all being well, the edgeAgent and edgeHub targets should be showing as “UP”;
Configure Grafana
Finally, now that we have Prometheus configured to grab our Metrics feeds, we can configure Grafana to show some of them on a Dashboard.
If you haven’t already installed Grafana, there’s a great tutorial on the Grafana Website here;
https://grafana.com/tutorials/install-grafana-on-raspberry-pi/
Once you have Grafana set up and configured, we need to add our Prometheus Data Source.
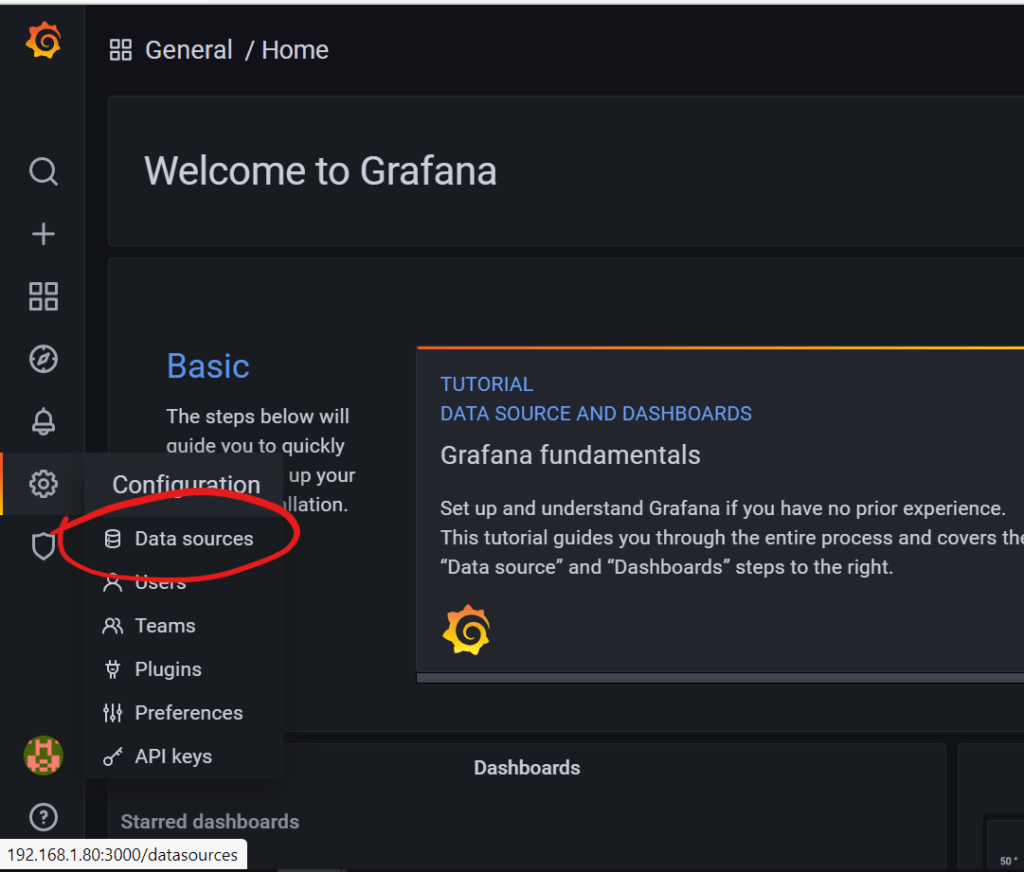
Hover over the Configuration gear icon and select the “Data sources” item;
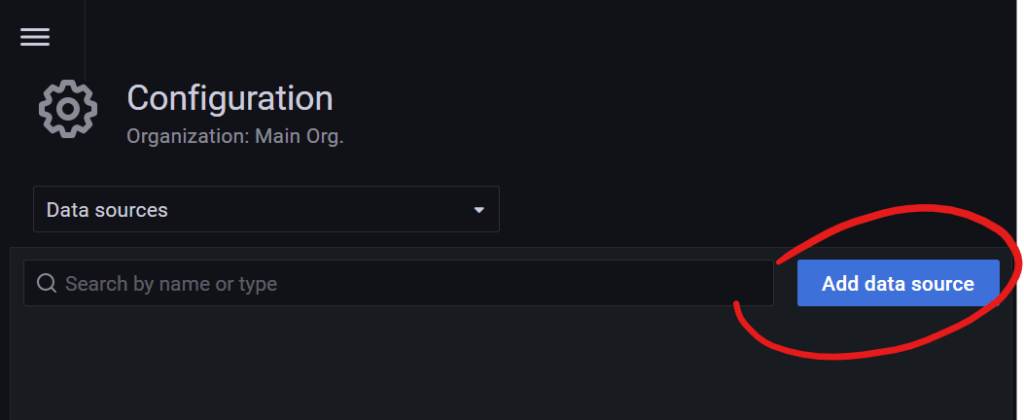
Next click the “Add data source” button;
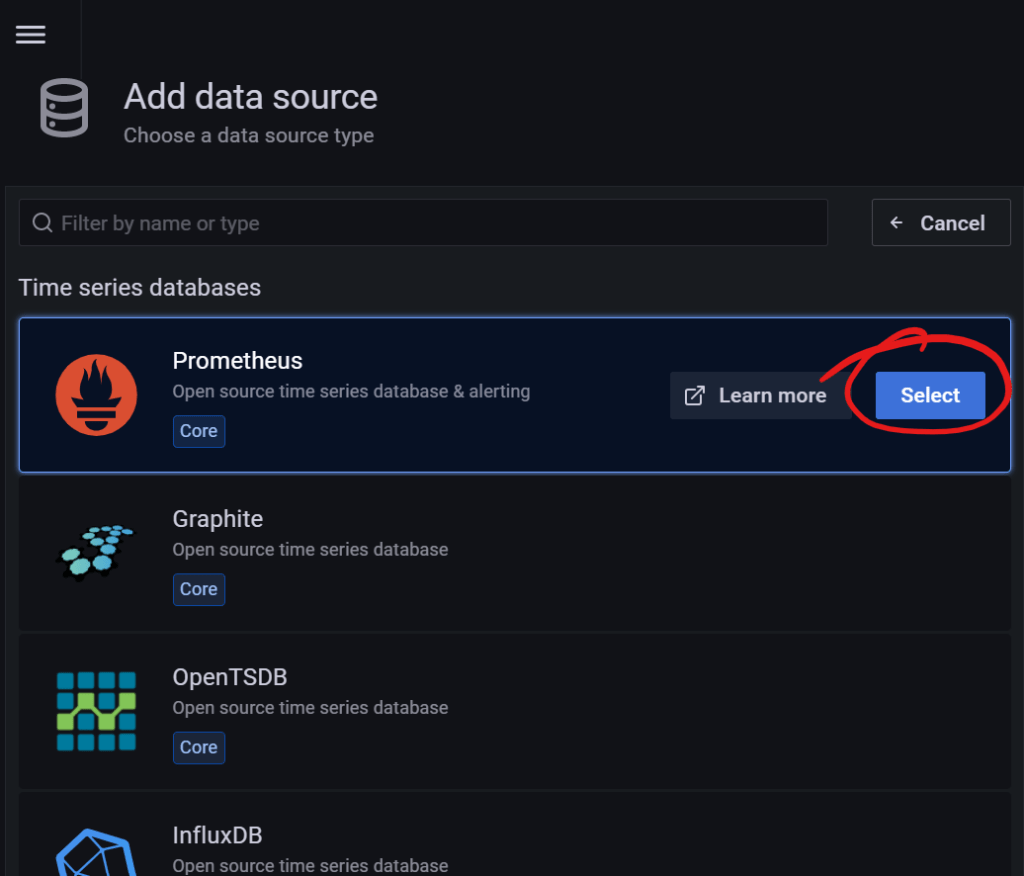
We’ll be shown a list of “Time series databases” to choose from. Select the “Prometheus” option;
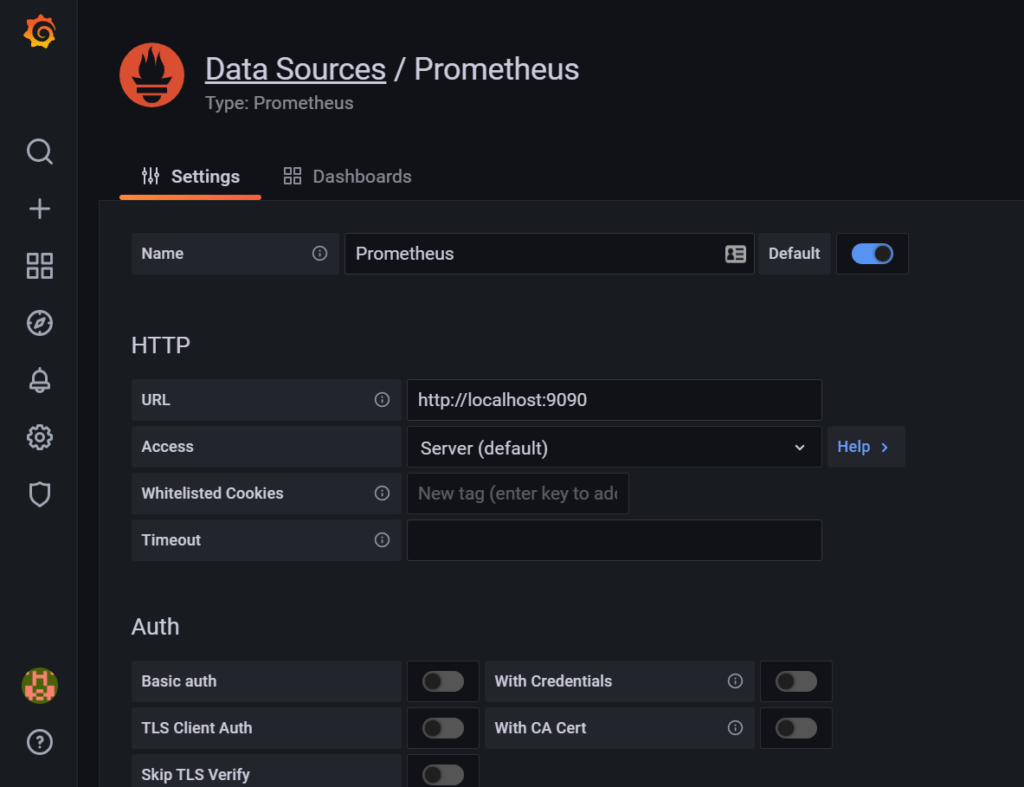
Give your Data Source a name, for instance “Prometheus”, and set the URL to be the same as the Prometheus URL, leaving the Access” as “Server (default)”;
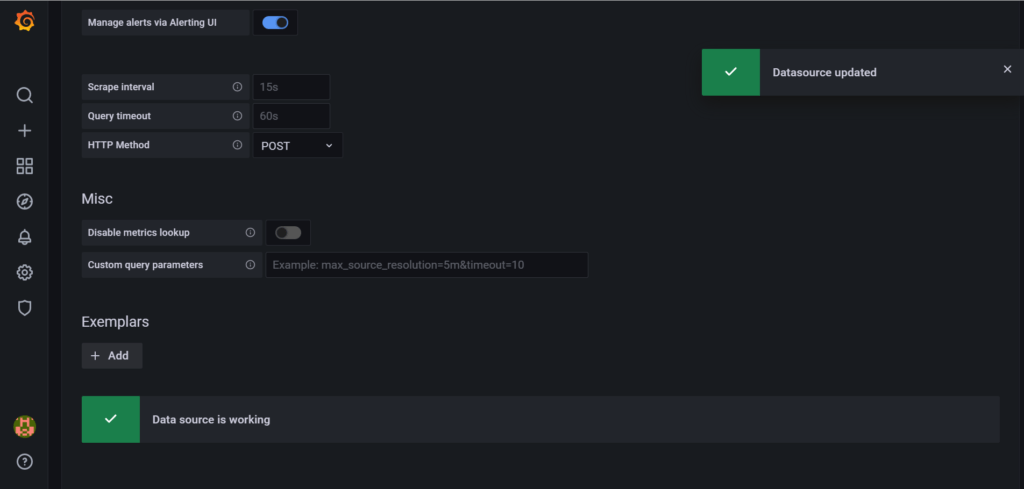
Leave all the other options at their defaults and hit the “Save & test” button to check that everything is working correctly;
Create a Simple Grafana Dashboard
With our Prometheus Data Source configured, we can now create a simple dashboard to bring in some of basic metrics from our IoT Edge installation.
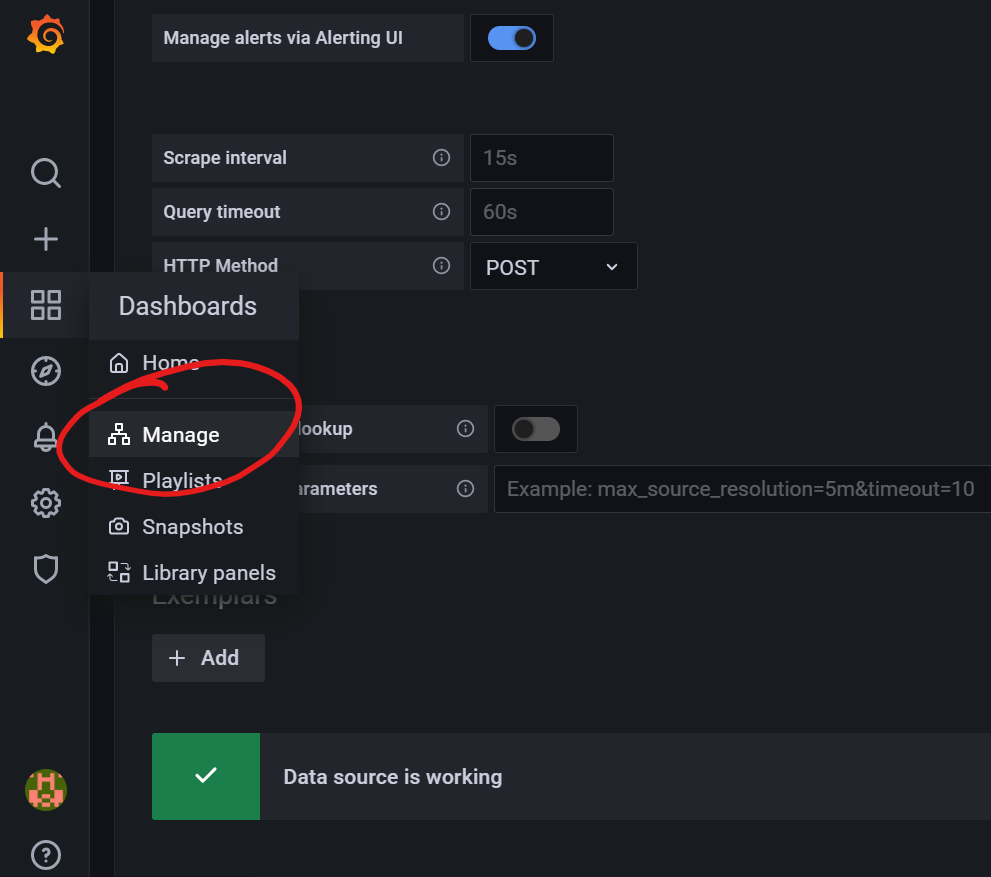
If you hover over the Dashboards icon and select “Manage”;
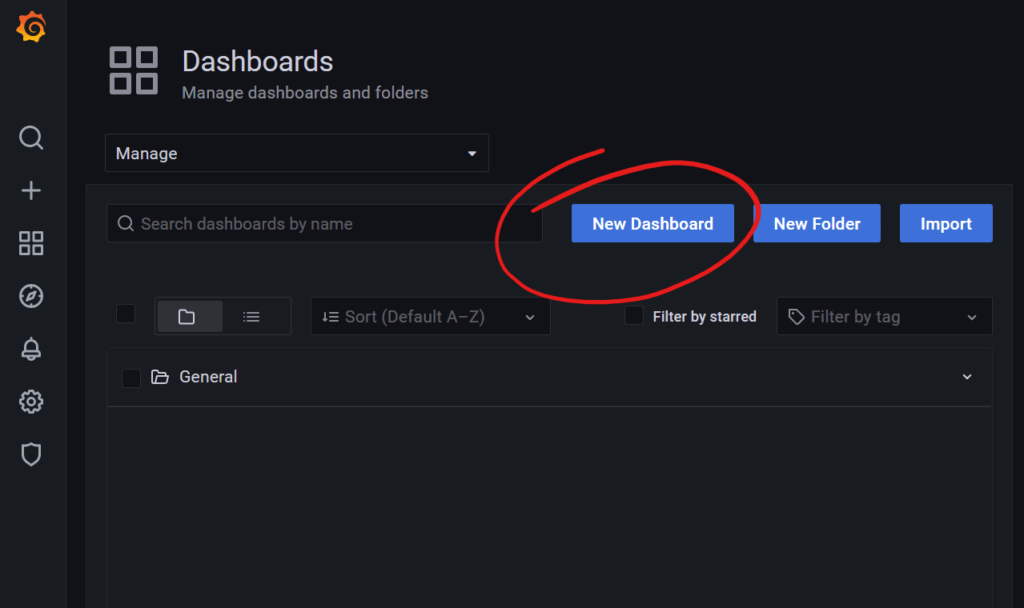
We then then click the “New Dashboard” button to begin creating our new Dashboard;
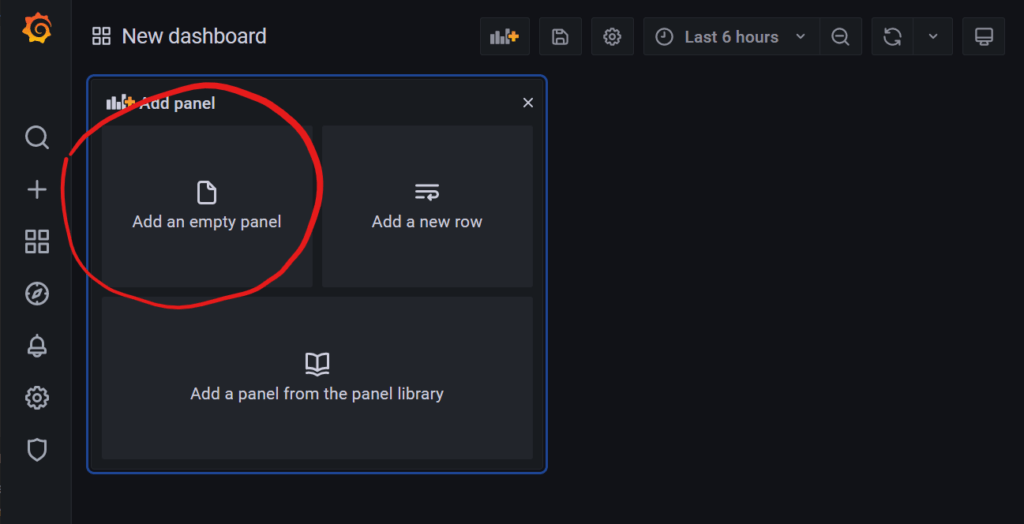
We’ll then be shown the “New dashboard” screen, where we can add our first panel by pressing the “Add an empty panel” button;
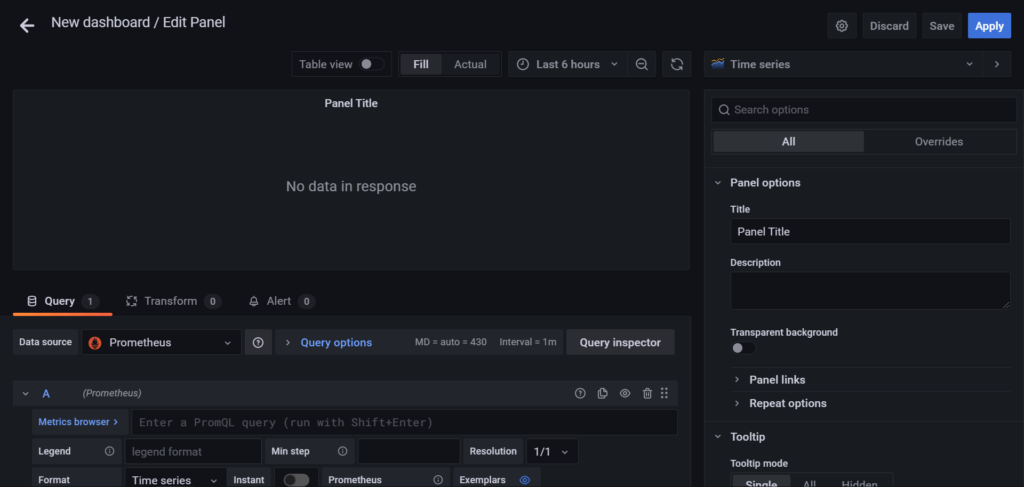
We’ll then be shown the panel options, including the Panel Options on the right and the “PromQL” query area at the bottom;
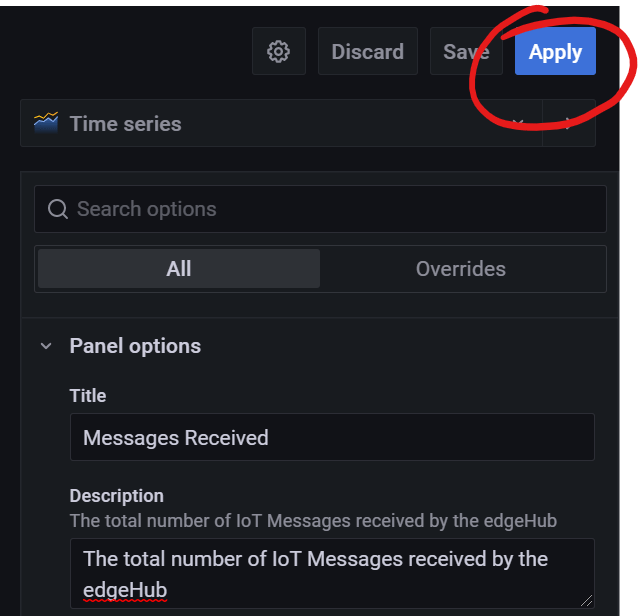
Let’s add a graph for the number of messages received. We can leave the Visualisation Type set to “Time series” on the right, and enter a Title of “Messages Received” along with a suitable description.
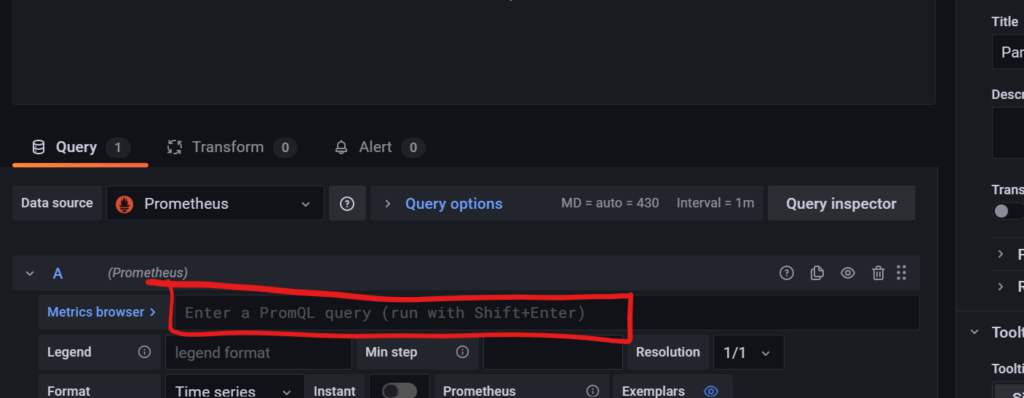
To add a particular metric, we query it using the PromQL” query area at the bottom;
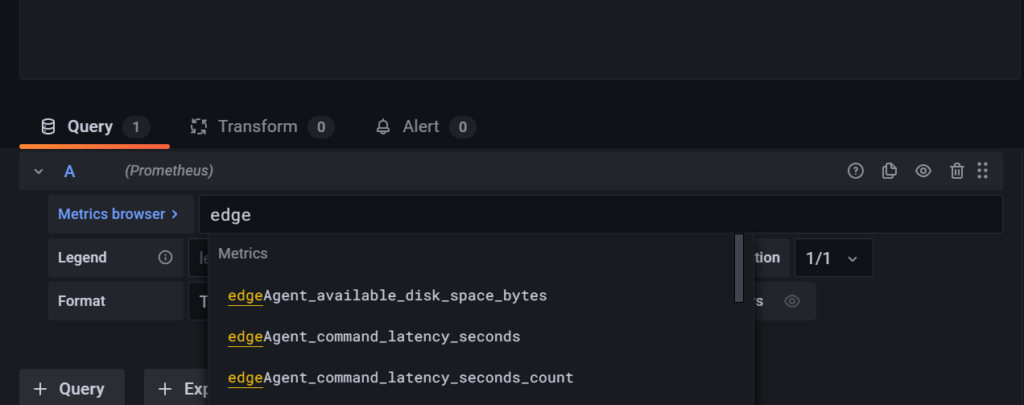
If we type “edge” in the PromQL area, we’ll now start to see the list of IoT Edge Metrics available to us;
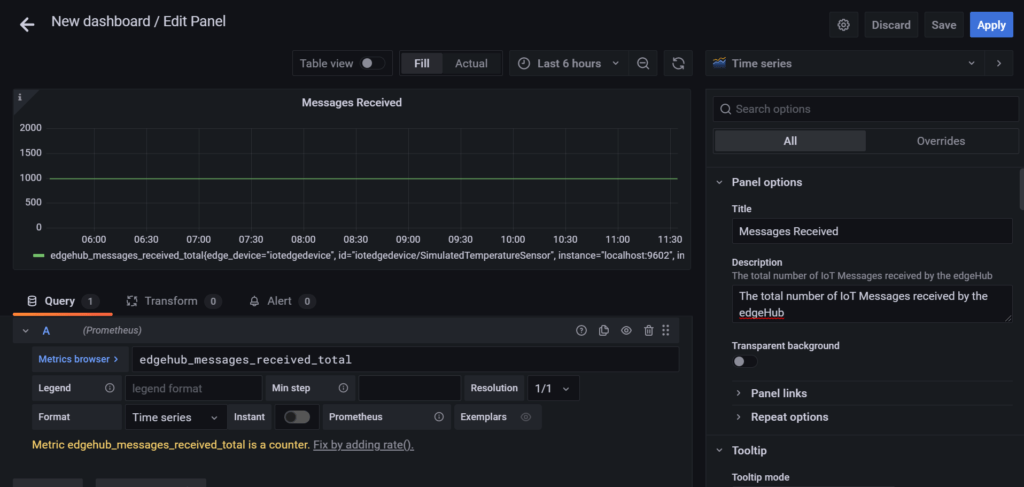
We’re interested in the total number of messages received by the edgeHub Module, so enter “edgehub_messages_received_total”.
If we now hit “shift+enter”, our panel will update with a preview of the data;
Save the new Panel by pressing the “Apply” button in the top right hand corner of the screen;
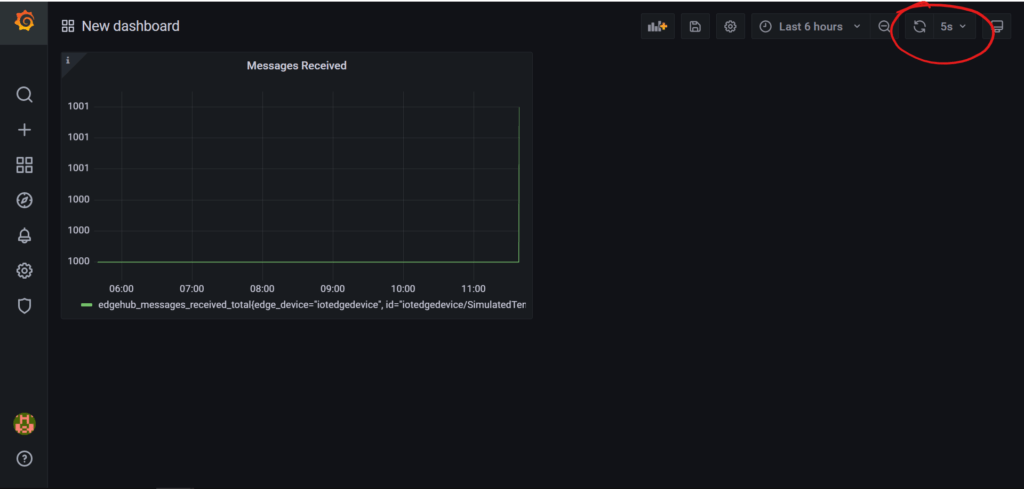
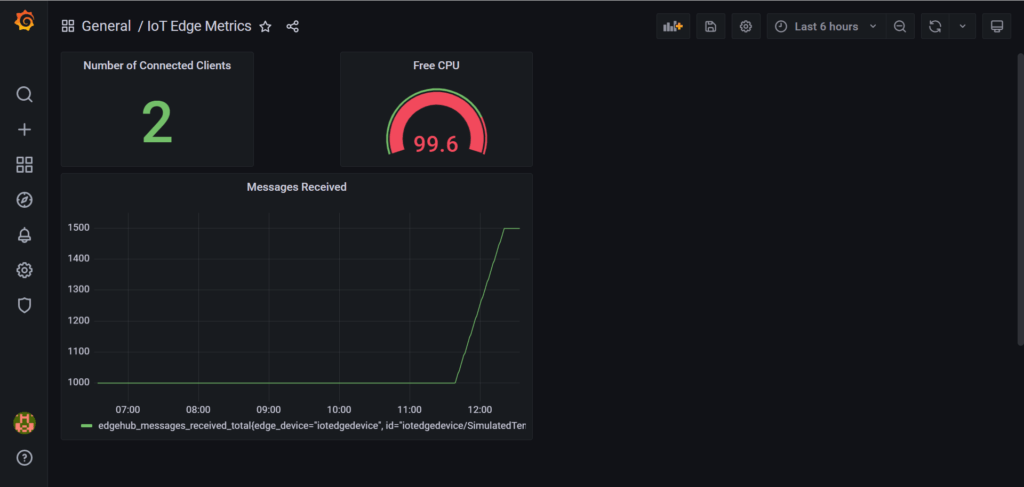
Our dashboard will then show our Messages Received graph. We can have the dashboard automatically update the metrics it’s showing by clicking the Refresh Interval dropdown and selecting a suitable refresh rate… I’ve chosen 5 seconds here;
Next let’s add a Connected Clients metric, this will show the number of either connected devices or modules connected to our edgeHub Module.
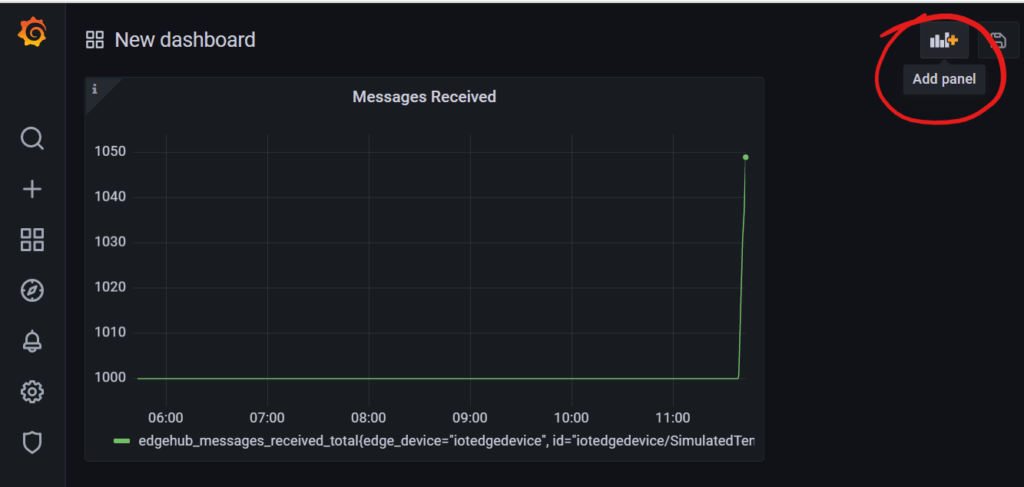
Click the New Panel icon in the top right menu and once again select “Add an empty panel”;
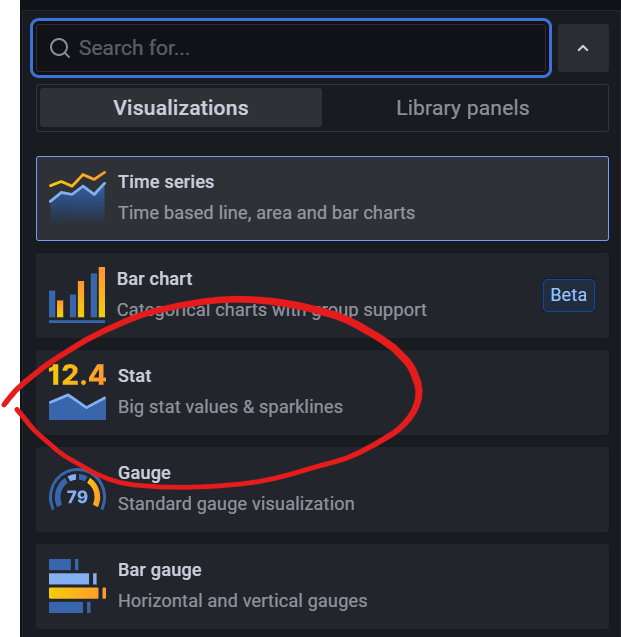
This time we’ll just add a simple text readout of the metric. From the Visualisation Dropdown, select the “Stat” option;
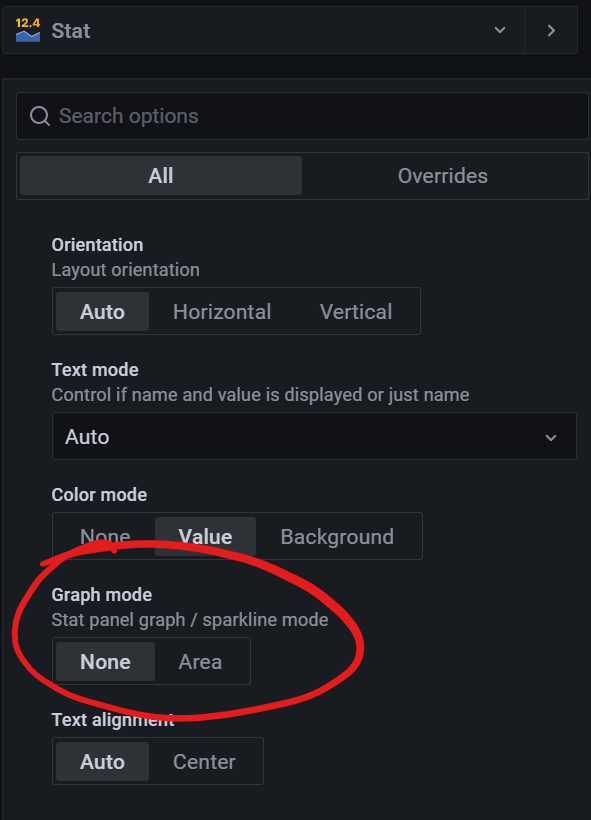
Give the Panel a Title of “Number of Connected Devices” and a suitable description. Then scroll down to the “Graph mode” options and select the “None” option to remove the graph;
In the PromQL area, enter “edgehub_connected_clients”, then hit the “Apply” button in the top right to add the panel to our dashboard. You can grab the corner of the panel to resize it if you like too;
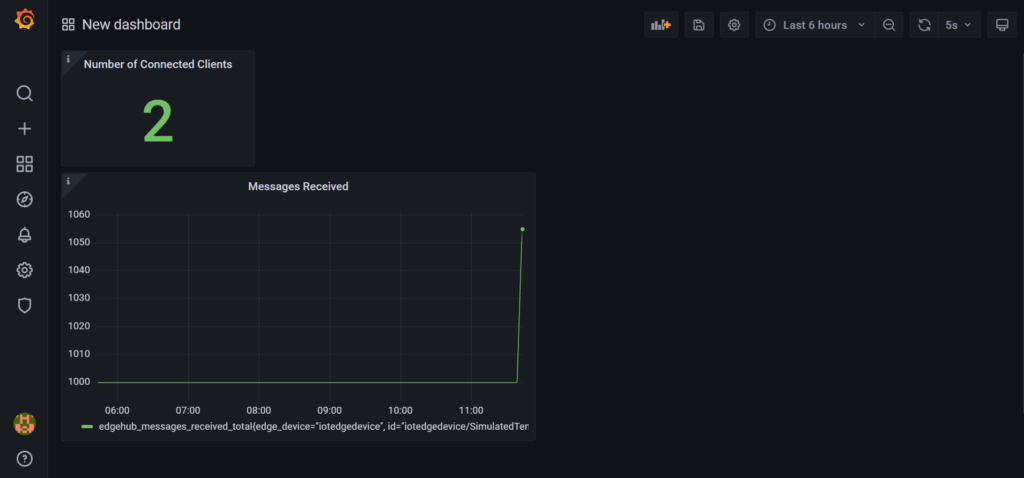
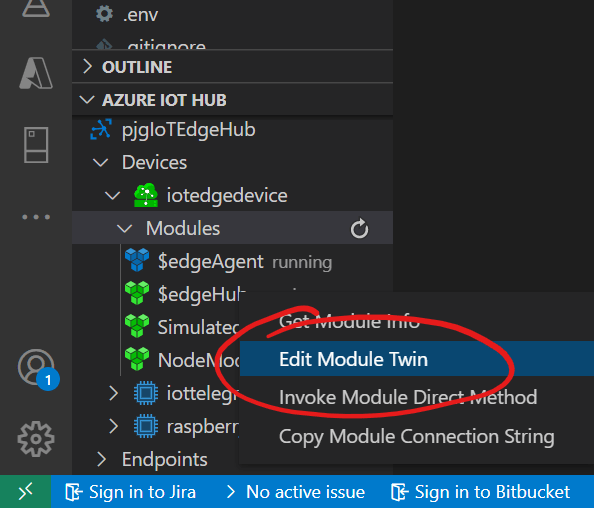
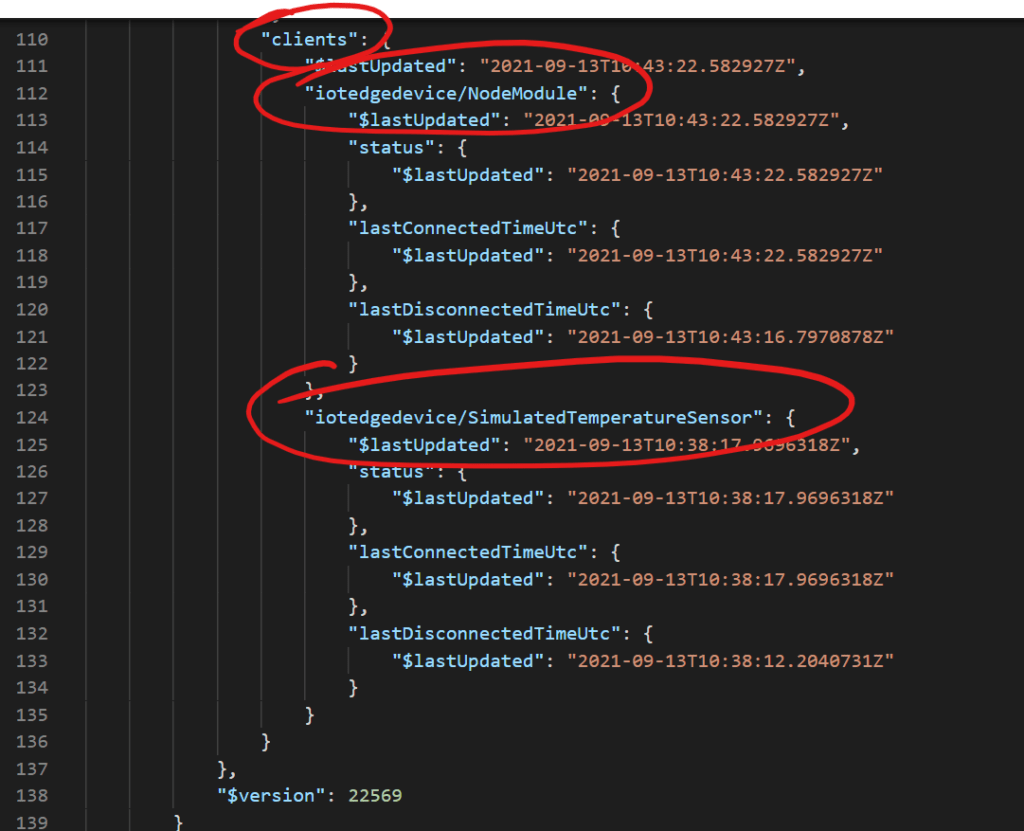
As a note, we’re showing a value of 2 for the number of Connected Clients, as we have two modules connected to the edgeHub module. We can see this if we view the module twin for the edgeHub. We can do this by expanding the IoT Edge Device in the Azure IoT Hub section of VS Code, expanding the Modules section, then right clicking on the “$edgeHub” module and selecting “Edit Module Twin”;
This will then show us the Module Twin for the edgeHub Module. If we scroll down to the “Reported Properties” section and to the “clients” section, we can see the connected clients. In my case I have a “NodeModule” client and a “SimulatedTemperatureSensor” client;
Finally, let’s add a free CPU % gauge to our dashboard. Add another new empty panel using the “New Panel” icon in the menu and selecting “Add an empty panel”.
Select “Gauge” from the Visualisation Options.
We’ll now shortcut the creation of this panel by creating it using some JSON I’ve prepared.
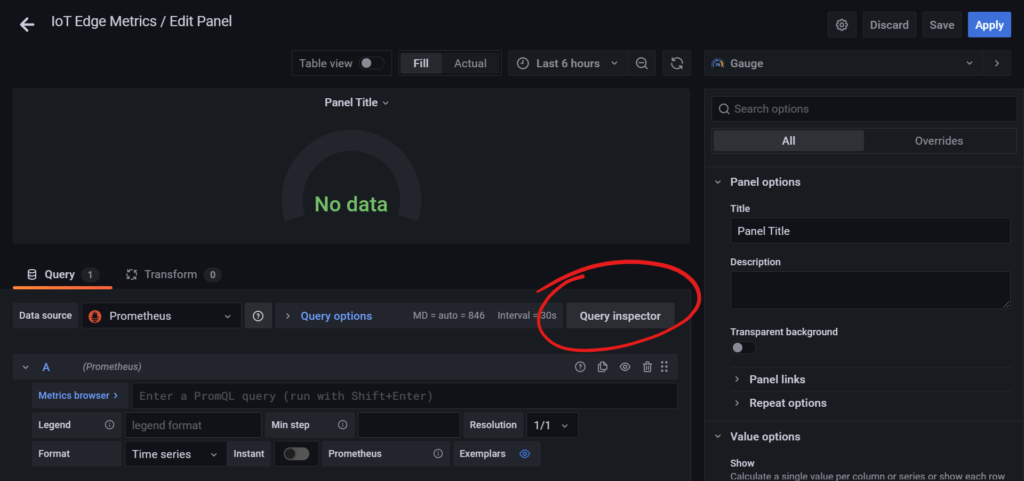
Click the “Query inspector” button to the right of the “Data source” panel;
Click the “JSON” option;
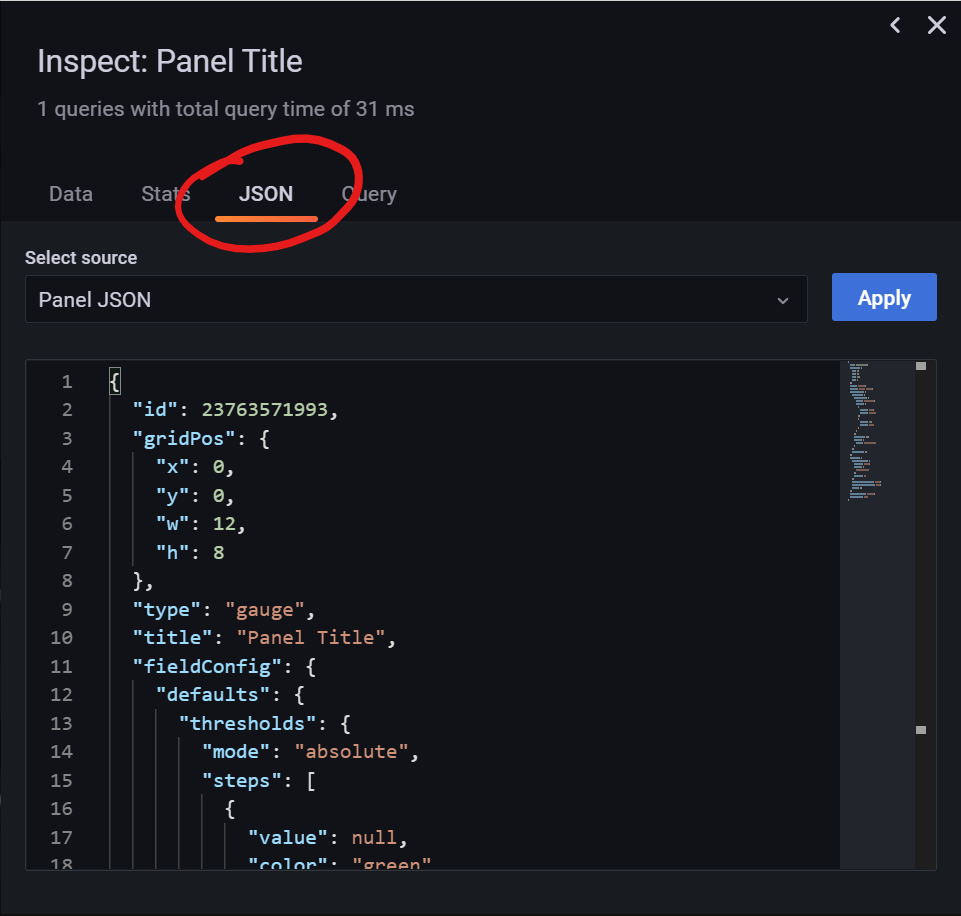
Remove the existing JSON and paste the following snippet of JSON in its place;
{
  "id": 23763571993,
  "gridPos": {
    "x": 7,
    "y": 0,
    "w": 5,
    "h": 4
  },
  "type": "gauge",
  "title": "Free CPU",
  "pluginVersion": "8.1.3",
  "targets": [
    {
      "expr": "edgeAgent_used_cpu_percent{quantile=\"0.99\",module_name=\"host\"}",
      "legendFormat": "",
      "interval": "",
      "exemplar": true,
      "refId": "A",
      "instant": true,
      "hide": true
    },
    {
      "expr": "edgeAgent_used_cpu_percent{quantile=\"0.99\",module_name=\"edgeAgent\"}",
      "legendFormat": "Edge Agent used CPU %",
      "interval": "",
      "exemplar": true,
      "refId": "B",
      "hide": true,
      "instant": true
    },
    {
      "expr": "edgeAgent_used_cpu_percent{quantile=\"0.99\",module_name=\"edgeHub\"}",
      "legendFormat": "Edge Hub used CPU %",
      "interval": "",
      "exemplar": true,
      "refId": "C",
      "hide": true,
      "instant": true
    },
    {
      "refId": "D",
      "type": "math",
      "datasource": "__expr__",
      "hide": false,
      "expression": "$A - $B - $C"
    }
  ],
  "options": {
    "reduceOptions": {
      "values": false,
      "calcs": [
        "lastNotNull"
      ],
      "fields": ""
    },
    "showThresholdLabels": false,
    "showThresholdMarkers": true,
    "text": {}
  },
  "fieldConfig": {
    "defaults": {
      "thresholds": {
        "mode": "absolute",
        "steps": [
          {
            "value": null,
            "color": "green"
          },
          {
            "value": 80,
            "color": "red"
          }
        ]
      },
      "mappings": [],
      "color": {
        "mode": "thresholds"
      },
      "min": 0,
      "max": 100
    },
    "overrides": []
  },
  "datasource": null
}
We can now hit the “Apply” button and our panel preview will be shown;
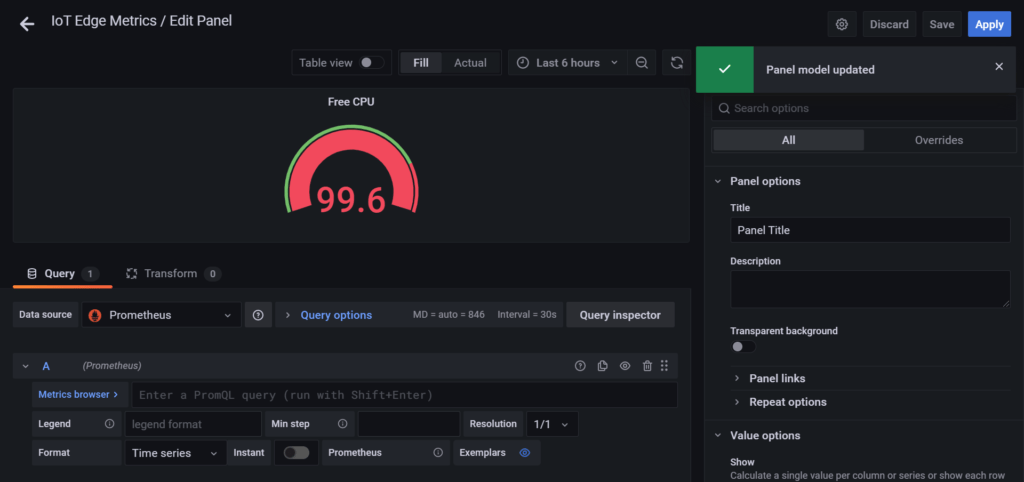
The Query section won’t automatically update, however we’ve collected the CPU usage metrics from the edgeHub and edgeAgent Modules and subtracted them from the Host CPU Metric to give us the figure used by the runtime modules of our IoT Edge Solution;
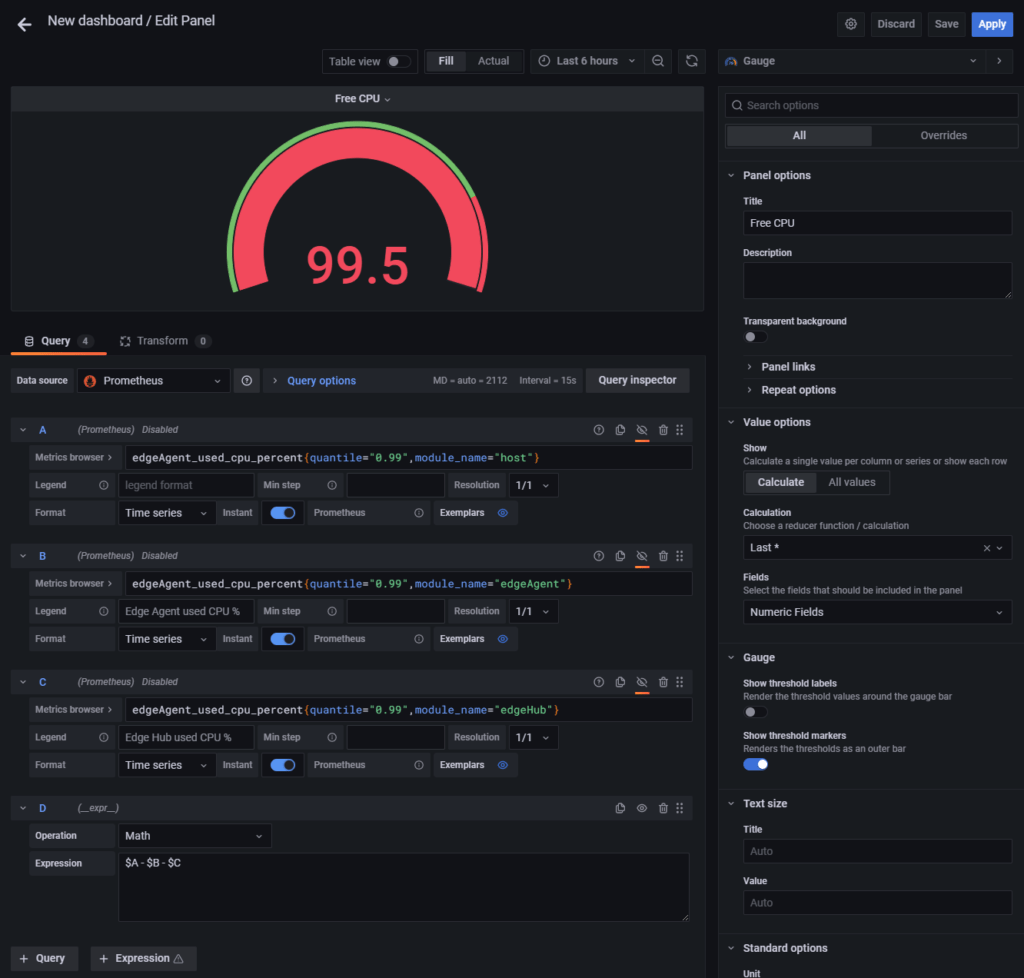
Of course, you would need to also add in any other modules you have deployed to your IoT Edge Solution to make this figure accurate, but for demo purposes, this is fine.
Click the blue Apply button to save the panel and you should now have a rudimentary DashBoard;
Go ahead and save your dashboard by clicking the Save Icon in the Menu and choosing a suitable name.
For reference, you can find a reference for all of the IoT Edge Metrics here;

